For an enhanced digital experience, read this story in the ezine.
From the director’s desk to the programmer’s activity guide, park and recreation professionals regularly rely on actionable data to make informed decisions. Whether an agency is developing a new master plan, determining what new programs to offer or seeking to understand their community’s characteristics a little better, access to relevant data will strengthen these initiatives.
NRPA offers a variety of data tools and research reports to meet this need. Check out Park Metrics to benchmark your agency’s parks, programming and budgetary information compared to peer agencies. NRPA also publishes research reports you can use to improve operations, gain more funding support and better serve your community. However, you likely still have data needs that extend beyond these great resources. That’s where NRPA’s Data and Mapping Resource Library comes in.
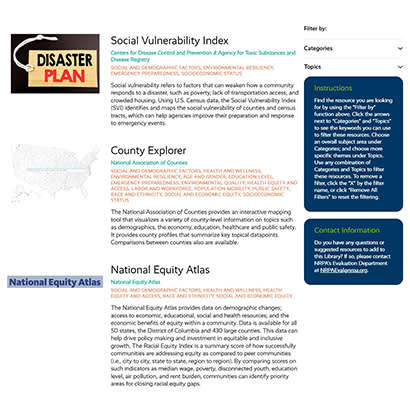
The internet is replete with publicly accessible data and mapping tools. These tools, often developed by government agencies, nonprofits or universities, cover a variety of topics but might be challenging for a busy professional to find and use. To make things easier, NRPA staff have compiled more than 50 free data and mapping resources to assist your agency in broadening its impact on the community and operating more efficiently. From the county level to your local neighborhood, these public resources serve as a starting point for exploring data on a variety of categories, including demographics, health and wellness, environmental resiliency and other park-specific information.
The library includes a short summary of each data tool and the level of geographic detail each tool provides (county, city, census tract). The resources also are filterable by categories (listed above) or more specific topics, such as: environmental quality, health equity/access and public safety. Using the filters, you quickly can hone in on resources that are of most interest to you.
Let’s look at a few scenarios that show how these data resources might be useful to a park and recreation professional:
1. Establishing new programming for children:
Your agency serves a large population and geographic area. As a recreation programmer, you are tasked with developing new youth programming that will serve areas most in need of investment. The Childhood Opportunity Index can help you identify neighborhoods in your jurisdiction where children currently have unequal access to opportunity. These data may be helpful in determining where to provide this new youth programming.
2. Understanding your community’s characteristics:
Imagine this: you just took a new job as a director at a new agency. You have spent the first few weeks meeting with your new colleagues and engaging with as many community members as you can. However, some basic questions about the people and places remain. With just a few clicks, SparkMap’s Community Assessment Tool can help you generate detailed reports about your new community and its characteristics.
3. Planning for the impacts of climate change:
If your agency wants to understand how climate change might impact your existing inventory of parks and facilities and how to mitigate long-term impacts on new capital projects, you can access Risk Factor. This tool allows you to view the likelihood and severity of risk from flooding, wildfire, heat and wind both today and in 30 years as a result of a changing climate. You can view these risks for specific addresses or broader geographies.
These are just three of the 50 resources hosted in the Data and Mapping Resource Library. I encourage you to check out the library for yourself. If you have a question or suggestion about the Data and Mapping Resource Library, we’d love to hear from you! Please contact NRPA’s Evaluation Department.
Austin Barrett is Senior Evaluation Manager at NRPA.

