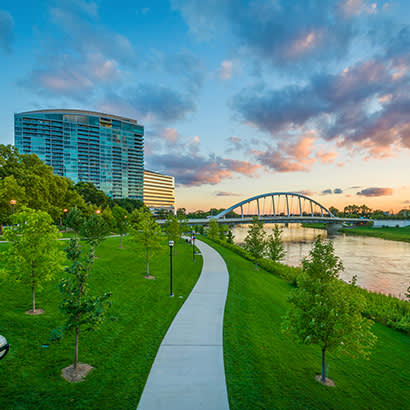
Greenways are linear urban green spaces that not only connect parks, neighborhoods, businesses and other public spaces, but also strengthen the quality of life for residents through connectivity and outdoor recreation. Some studies have highlighted the positive health impacts of greenways, but not all residents have the same access to them. The differing opportunities to easily use greenways influence health. Thus, it is important to examine whether neighborhoods with different demographic and socioeconomic statuses have equal access to greenways.
The city of San Antonio completed construction on a portion of its greenway system in 2018. The recently built portion of the system serves as a case study for conducting analysis to measure accessibility for various residents. These findings can help planners and policymakers investigate equality, or lack thereof, in access to greenways and develop policy directions to guide future decision-making.
The Methodology
Census data was gathered and mapped to investigate the socioeconomic factors in Bexar County, Texas, which includes San Antonio. Geographic Information System (GIS) data, including information on streets, greenway trails and trailheads — indicating greenway entrances — were pulled from online city sources. Environmental Systems Research Institute ArcMap tools assisted in measuring network distance (the shortest path between two locations) to investigate accessibility. These functions allow researchers to search a point on a map and find the closest facilities to that point.
The study measured accessibility using network distances (along streets) from each neighborhood to the nearest greenway entrances. It also captured the number of greenway entrances within specific distances (one, three and five miles, respectively) of the center of each Census block group.
It was assumed formal greenway route entrances (i.e., parking lots) were the only accessible places. Accessibility was calculated using the shortest network distance from the center point of Census block groups to each greenway route entrance and the “service area” looked at the number of greenway entrances within one, three and five miles from the block groups.
Key Study Findings
The results indicate San Antonio’s city center has a denser population than its outer area. The north side of Bexar County had a more significant proportion of households with high household incomes and per capita incomes than those of the south side. Furthermore, the urban area has higher greenway accessibility according to the network distance and the number of service areas than the suburban area. Block groups in urban areas had shorter distances to the nearest greenway entrances and tended to have more greenway entrances within one, three and five miles than those in suburban areas. Meanwhile, data indicate education level and household income had an impact on the number of greenway entrances accessible within five miles. Spatial analysis also indicated the area with more housing units had lower accessibility of the greenway system. Other results depicted that population density, age, percentage of African American, Hispanic or Latino, female, high-educational attainment and unemployed rate of the block group were also related to accessibility outcomes.
Application for Practice
Over time, the field has tried to understand residential access to green infrastructure better and has made progress due to advances in technology. However, key concerns still exist and merit attention regarding methodological design and application. Methodologically, we need to revisit and better define “access,” as well as identify related technologies for efficient analysis.
This case study was based on a distance-based approach, but low socioeconomic status (SES) groups face more challenges in accessing greenways than distance alone. In future studies, more temporal and social barriers that the low SES groups face should be taken into consideration. However, we need to further develop practical mapping methodologies for these indicators.
What’s more, most studies focus on residential access. For example, the greenways in this case study were less accessible to residential areas. That is, the area with more housing units had lower accessibility of the greenway system. Given that greenway systems often aim to improve citizens’ health, efforts should focus on improving accessibility to areas with more housing units.
Additionally, while infrastructure such as greenway trails are generally considered positive additions to an area, associated affordable housing issues have introduced gentrification concerns in some U.S. neighborhoods. Through collaboration, tools potentially could be refined to identify and verify factors and timelines associated with gentrification and to develop models to support municipalities in monitoring and minimizing tipping points.
Over time, GIS analysis has assisted researchers and practitioners in better understanding key relevant spatial issues in parks and recreation. As technology enhancements refine and expedite the ability to conduct such analysis, opportunities exist for the field at large to further develop best practices in measurement, analysis and application.
Jeongseup Lee is a Ph.D. student at Texas A&M University. Jamie Rae Walker is Associate Professor and Extension Specialist at Texas A&M University.

