 For almost any activity, whether work or play, people are interested in how what they’re doing compares to others. If we’re playing a sport, we keep score to see who’s playing better. We try to keep our yard looking nicer than the family who lives across the street. We want to know how the schools our children attend rank compared to others in the area. And, as a park and recreation professional, you very likely would want to know how your programs and facilities compare to other agencies across the country or in your region. This is exactly what PRORAGIS™ is designed to help you do.
The newly launched update to PRORAGIS provides dramatic improvements in both usability and function, but it is still based on the idea that the power to compare your agency to similar entities across the country is a valuable tool for improving how you manage your parks and programs. PRORAGIS allows the user to find comparable agencies using fully customizable search tools, and then analyze their operating data against either a specific agency, group of agencies or all agencies in the system. The completely redesigned geographic information system (GIS) interface offers PRORAGIS users even more powerful tools to visualize, study and improve their parks and facilities. While the specific improvements are too numerous to discuss here, the On-Demand Data Reports and the Census Layer GIS functions deserve special attention.
On-Demand Data Reports: The new On-Demand Data Reports function of PRORAGIS quickly and easily gives users some of the most commonly used operating information from the database. Users can choose from more than 20 options, and with one click they can see the means, medians and/or quartiles from all agencies in the database. For instance, if the user was interested in learning the operating expenditures per full-time employee for 2011 from all agencies in PRORAGIS, a few quick clicks from the On-Demand Data Reports menu would show that the median expenditure per full-time employee from the more than 200 respondents was $95,851. While this information is available using the standard reporting function of PRORAGIS, On-Demand Data Reports provides this and other popular benchmarking metrics in a faster and more concise manner.
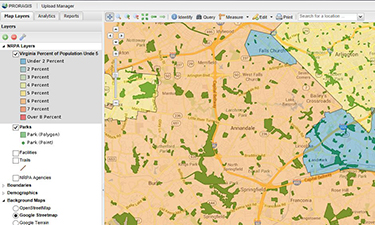
GIS Census Layers: One of the many exciting new GIS features allows PRORAGIS users to integrate the massive amount of social and economic data available through the Census with their park, facility and program information. This allows the user to visualize their parks and facilities on a map, then overlay customizable information to see how the population around their parks is changing in size and composition at a Census-block level. Rather than having to rely on anecdotal information, or city-, county- or state-level analyses of changes in population, PRORAGIS users much more closely examine this data and plan their programs and improvements accordingly. For instance, by using the Census layer that displays the percentage of the population 5 years or younger, park and recreation professionals can accurately target programs and improvements to areas where they will be most used.
To summarize, the new PRORAGIS is just like the park and recreation programs and facilities that our members manage — it’s constantly evolving to address your needs. These improvements, along with many others already in place or coming soon, offer you the opportunity to compare your agency to others, find opportunities for improvement and subsequently better serve your citizens. Don’t you want to know how you compare?
Travis Smith is NRPA’s Director of Research.

