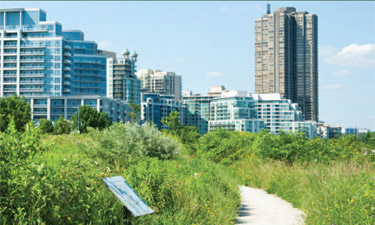
 In March, Toronto (Canada) Public Health released a report entitled The Walkable City: Neighbourhood Design and Preferences, Travel Choices and Health. The report highlights the relationship of neighborhood walkability with travel choices, levels of physical activity, and body weights of residents. Neighborhoods in Toronto were ranked for walkability levels using the walkability index, a widely used tool for evaluating neighborhood design features such as residential density, retail ratio, land use mix, and intersection density.
3: The number of times more often Toronto residents in the most walkable neighborhoods walk for utilitarian reasons—as compared to residents in the least walkable neighborhoods.
2.5: The number of times more often those in the most walkable neighborhoods use public transit than those in the least walkable neighborhoods.
4: The number of times less often those in the most walkable neighborhoods drive cars than residents in the least walkable neighborhoods.
45: The number of kilometers residents in the most walkable neighborhoods drive per week.
278: The number of kilometers residents in the least walkable neighborhoods drive per week.
26.0: The Body Mass Index (BMI) of residents in the most walkable neighborhoods.
27.3: The BMI of residents in the least walkable neighborhoods.
7: The approximate number of pounds difference between an individual with 26.0 BMI and 27.3 BMI.
74: The percentage of Toronto residents surveyed who expressed a strong preference for walkable neighborhoods.
6: The percentage of Toronto residents surveyed who expressed a strong preference for auto-oriented neighborhoods.
21-32: The percentage range of low-walkability neighborhood residents surveyed who expressed a strong desire for walkable neighborhood features.

